The web app
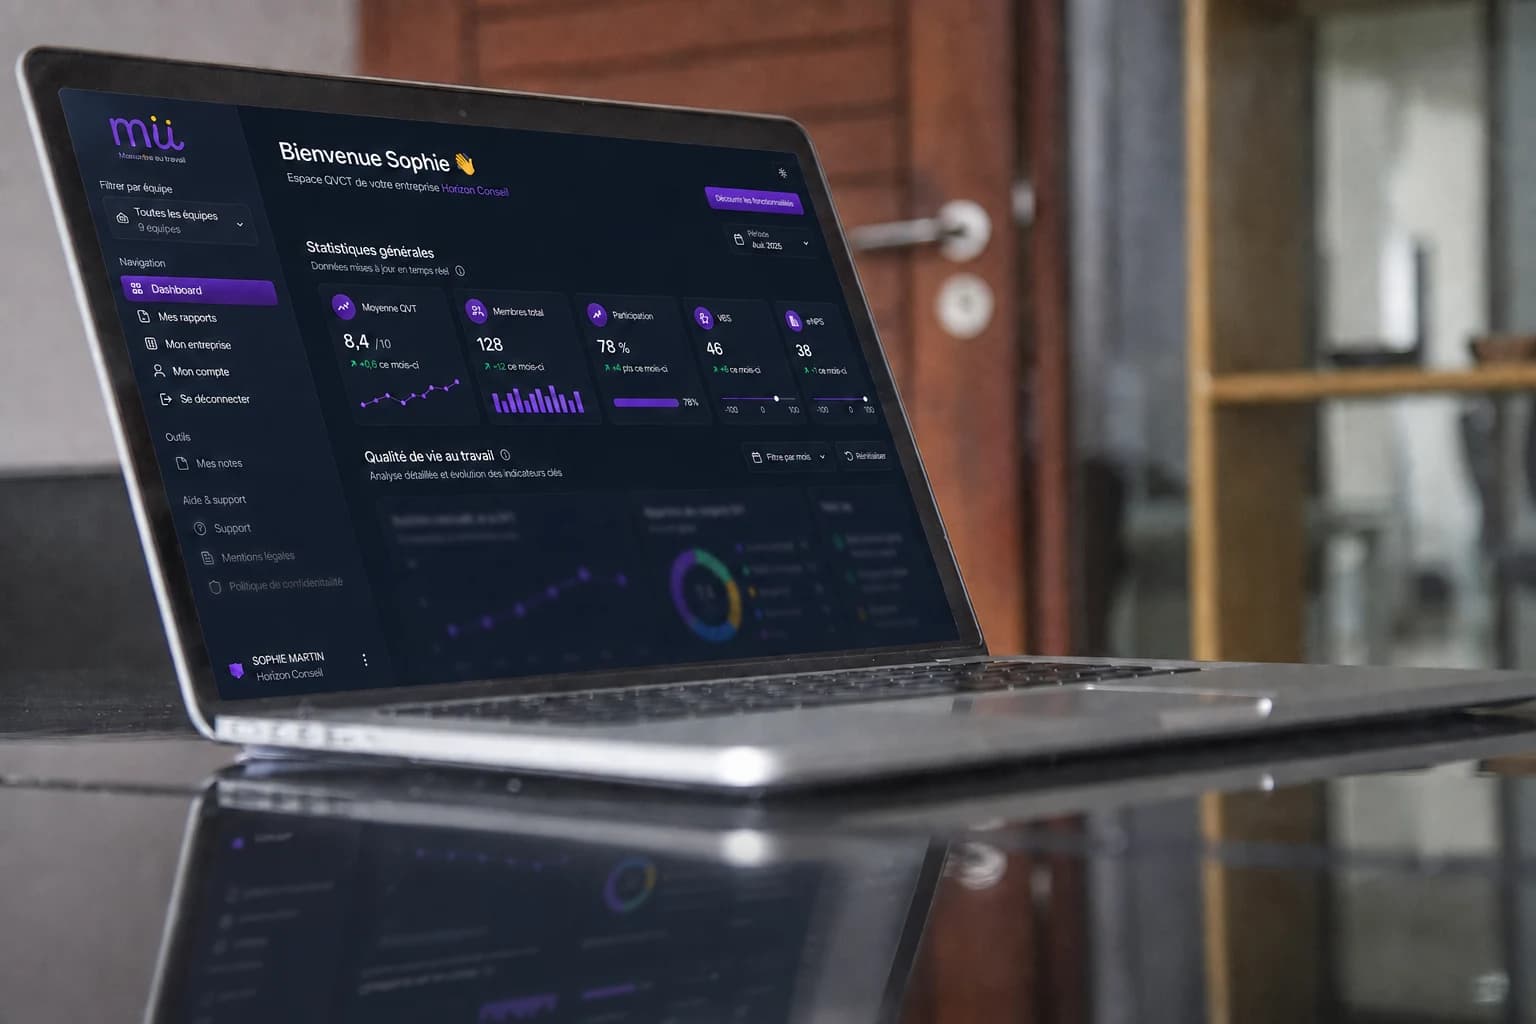
Your teams’ answers become readable indicators, clear priorities and action plans you can actually measure.
Your well-being barometer, in real time
Every answer updates your indicators — no re-entry, no spreadsheets.
What the app does
The essentials your leaders have in front of them.
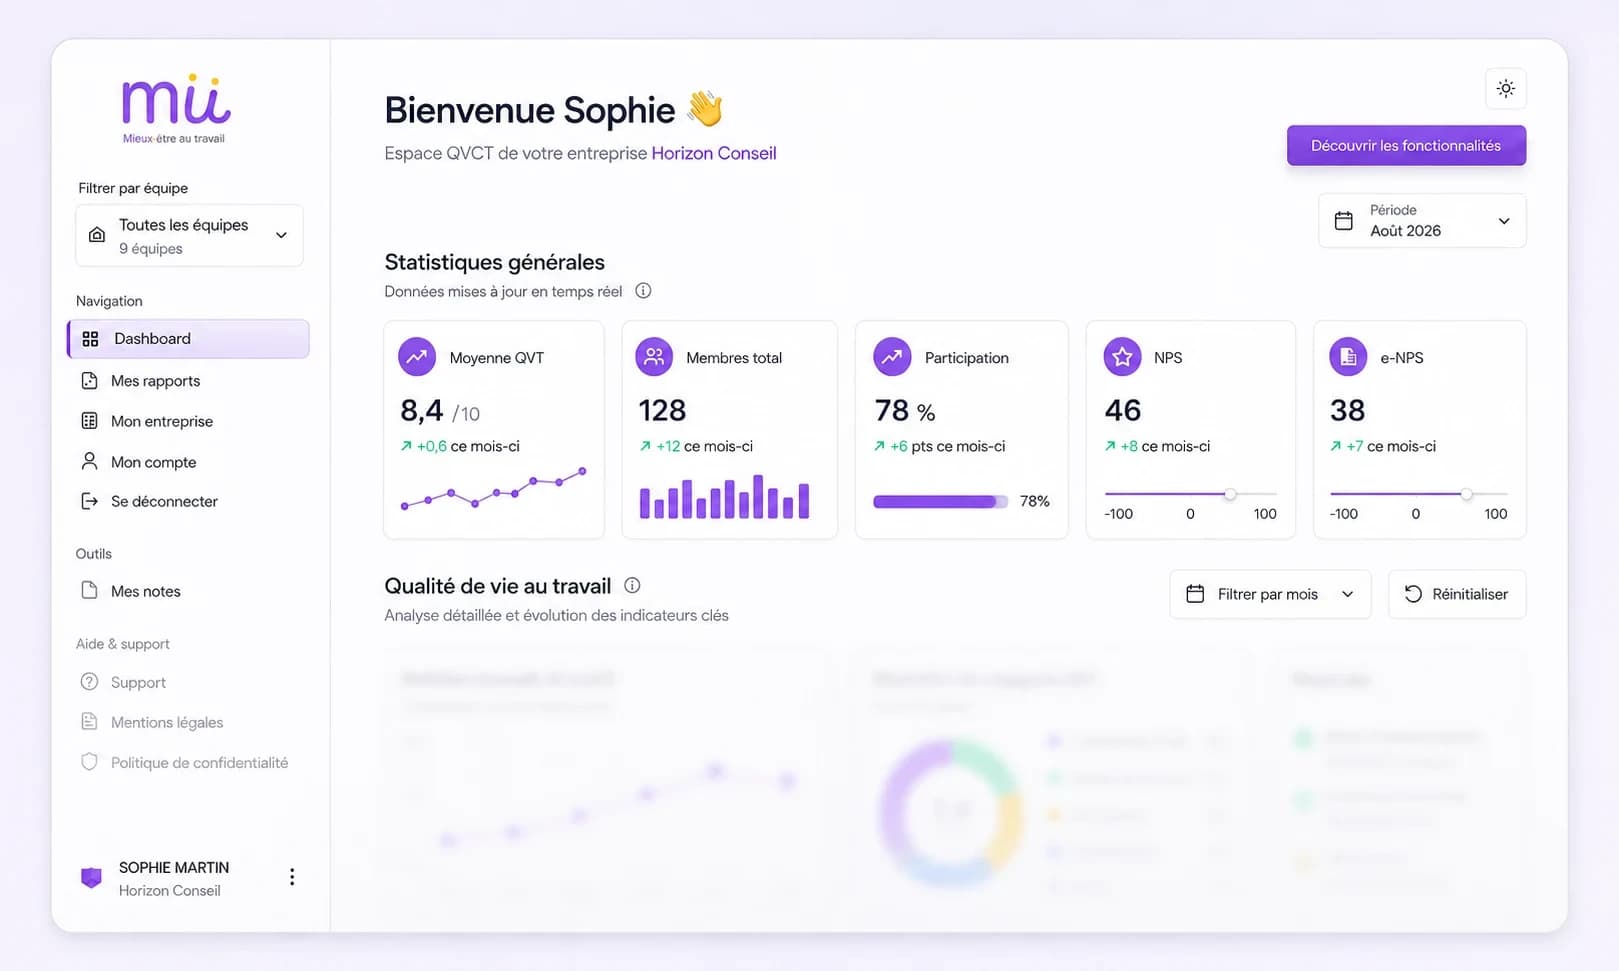
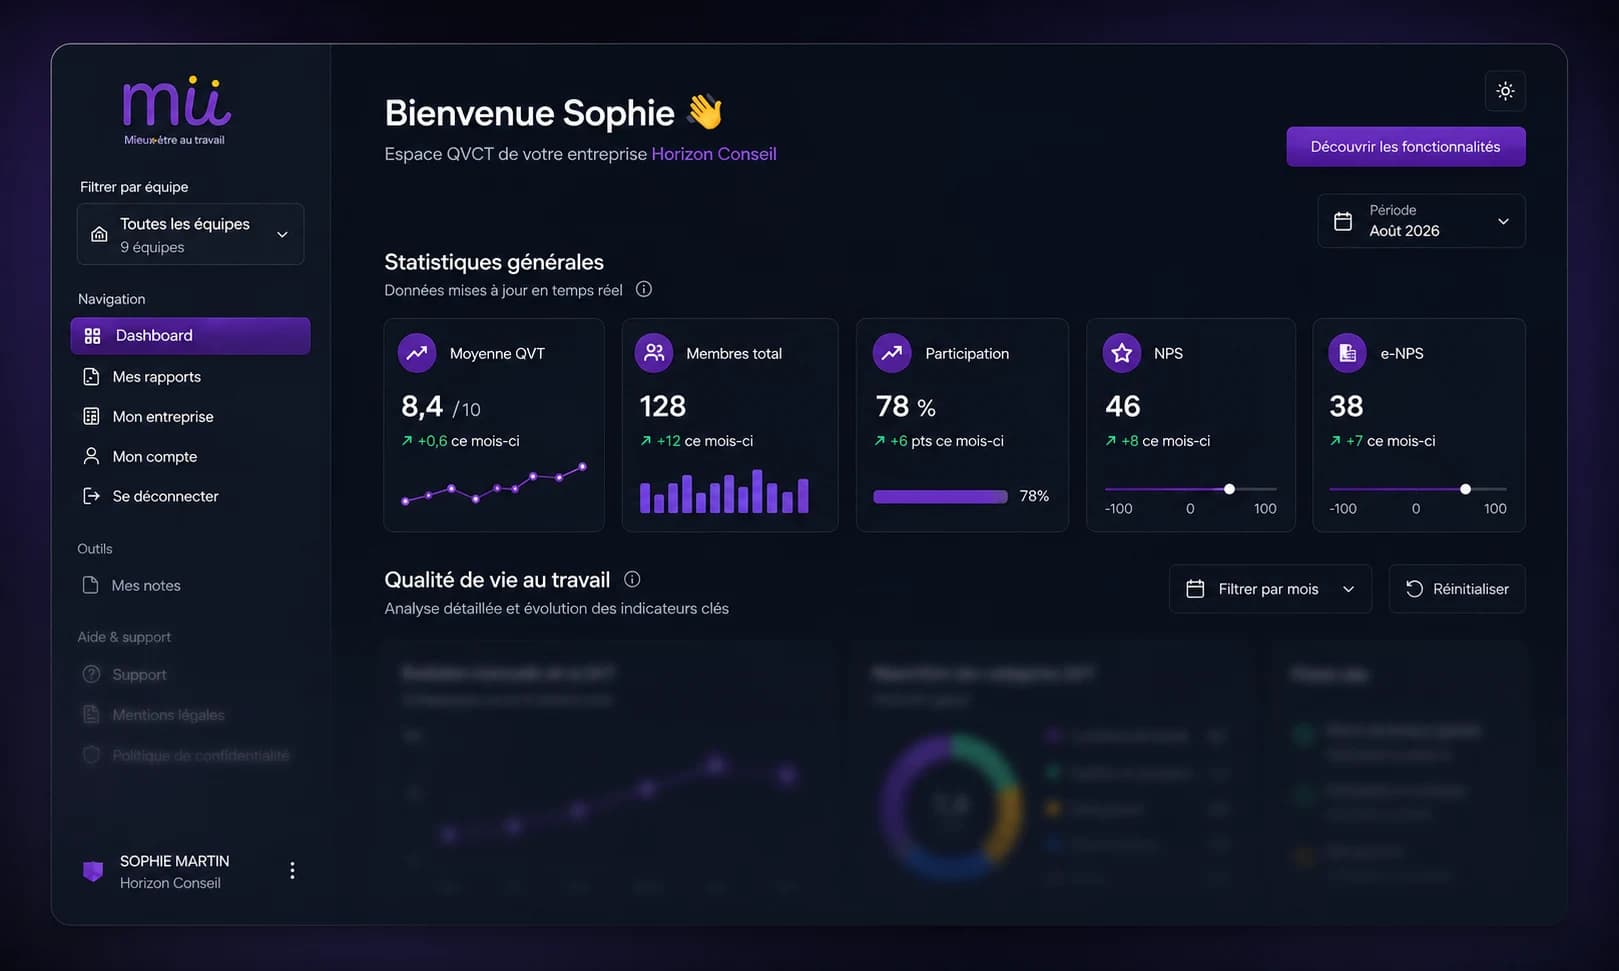
Readable dashboards
Engagement, internal NPS and six well-being dimensions, updated with every answer.
Filters at the right level
By team, department, site and period, to know where to act first.
Tracked action plans
Your priorities become dated actions, with an owner and impact measurement.
Reports ready to share
Exports and summaries ready for a works council, a board meeting or an audit.
The full history
Compare one period to the next and check that what you put in place actually works.
Role-based access
Each manager sees their own scope, leadership sees everything, anonymity thresholds are enforced.
Frequently asked questions
Leadership, HR teams and managers, each within their own scope. Access is set by role: a manager sees their team, leadership sees the whole picture.
Yes, that is where your teams’ answers come from. The web app is the other half: it turns those answers into indicators, priorities and action plans.
No. Results are aggregated and anonymity thresholds apply: below a minimum number of answers, the detail is not shown, whatever filter is used.
Yes. Summaries and exports are built to be shared as they are with a leadership committee, a works council or an audit, with no reformatting.
There is nothing to install. The workspace is configured around your teams, departments and sites, then updates with every answer, with no re-entry and no spreadsheet.
Want to see your data in the web app?
We will walk you through the dashboard in a demo, with data close to yours.